

echarts写仪表盘,指针到不同区域显示不同颜色 https://my.oschina.net/u/3549294/blog/1586818
|
1 2 3 4 5 6 7 8 9 10 11 12 13 14 15 16 17 18 19 20 21 22 23 24 25 26 27 28 29 30 31 32 33 34 35 36 37 38 39 40 41 42 43 44 45 46 47 48 49 50 51 52 53 54 55 56 57 58 59 60 61 62 63 64 65 66 67 68 69 70 71 72 73 74 75 76 77 78 79 80 81 82 83 84 85 86 87 88 89 90 91 92 93 94 95 96 97 98 99 100 101 102 103 104 105 106 107 108 109 110 111 112 113 114 115 116 117 118 119 120 121 122 123 124 125 126 127 128 129 130 131 132 133 134 135 136 137 138 139 140 141 142 143 144 145 146 147 148 149 150 151 152 153 154 155 156 157 158 159 160 161 162 163 164 165 166 167 168 169 170 171 172 173 174 175 176 177 178 179 180 181 182 183 184 185 186 187 188 189 190 191 192 193 194 195 196 197 198 199 200 201 202 203 204 205 206 207 208 209 210 211 212 213 214 215 216 217 218 219 220 221 222 223 224 225 226 227 228 229 230 231 232 233 234 235 236 237 238 239 240 241 242 243 244 245 246 247 248 249 250 251 252 253 254 255 256 257 258 259 260 261 262 263 264 265 266 267 268 269 270 271 272 273 274 275 276 277 278 279 280 281 282 283 284 285 286 287 288 289 290 291 292 293 294 295 296 297 298 299 300 301 302 303 304 305 306 307 308 309 310 311 312 313 314 315 316 317 318 319 320 321 322 323 324 325 326 327 328 329 330 331 332 333 334 335 336 337 338 339 340 341 342 343 344 345 346 347 348 349 350 351 352 353 354 355 356 357 358 359 360 361 362 363 364 365 366 367 368 369 370 371 372 373 374 375 376 377 378 379 380 381 382 383 |
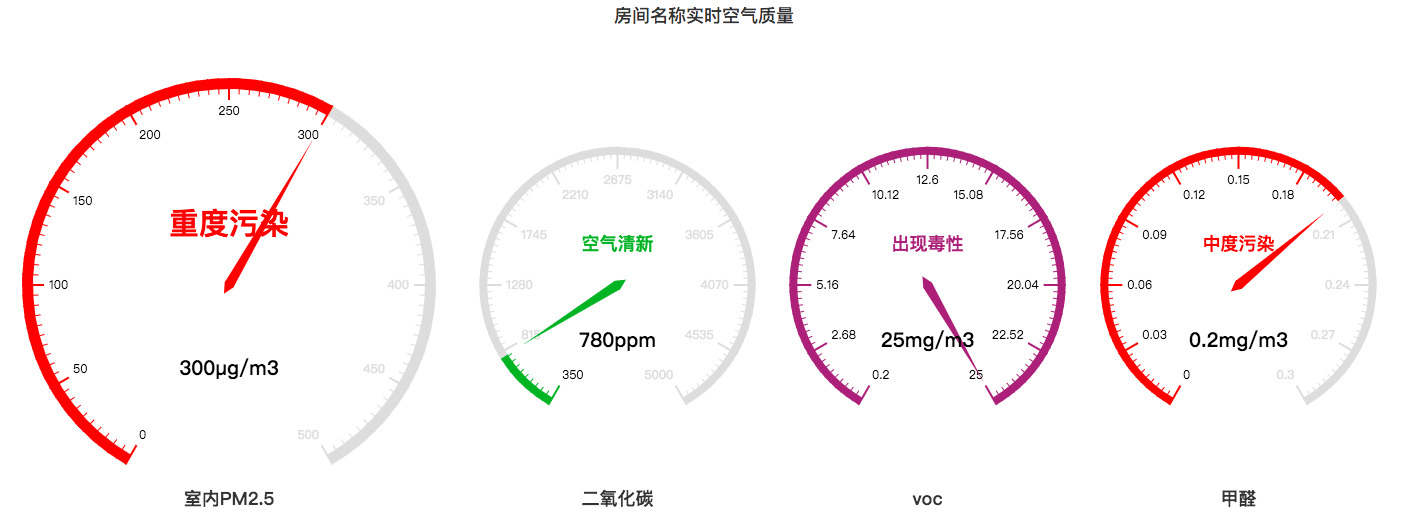
<!DOCTYPE html> <html lang="en"> <head> <meta charset="utf-8"> <meta http-equiv="X-UA-Compatible" content="IE=edge"> <meta name="viewport" content="width=device-width, initial-scale=1"> <title>空气质量</title> <link rel="stylesheet" href="http://v3.bootcss.com/dist/css/bootstrap.min.css"> <script src="https://cdn.bootcss.com/jquery/1.12.4/jquery.min.js"></script> <script src="http://echarts.baidu.com/dist/echarts.min.js"></script> </head> <body> <!--正文--> <div class="container-fluid"> <div class="title"> <h4 class="text-center">房间名称实时空气质量</h4> </div> <div class="gaugelabel"> <div class="gaugbox pull-left" style="width: 33%;"> <a href="#"> <div class="pull-left" id="pm" style="width: 100%;height: 500px"></div> </a> </div> <div class="gaugbox pull-left" style="width: 22%"> <a href="#"> <div class="pull-left" id="co2" style="width: 100%;height: 500px"></div> </a> </div> <div class="gaugbox pull-left" style="width: 22%"> <a href="#"> <div class="pull-left" id="voc" style="width: 100%;height: 500px"></div> </a> </div> <div class="gaugbox pull-left" style="width: 22%"> <a href="#"> <div class="pull-left" id="jqz" style="width: 100%;height: 500px"></div> </a> </div> </div> </div> </body> <script> $(document).ready(function() { gaugeimg('pm', '室内PM2.5', 0, 500, 300, 'μg/m3'); gaugeimg('co2', '二氧化碳', 350, 5000, 780, 'ppm'); gaugeimg('voc', 'voc', 0.2, 25, 25, 'mg/m3'); gaugeimg('jqz', '甲醛', 0, 0.30, 0.2, 'mg/m3'); /* *id:id; *title:仪表盘名称 *min:最小值 *max:最大值 *val:当前实际值 *unit:单位符号 */ function gaugeimg(id, title, min, max, val, unit) { var myChart = echarts.init(document.getElementById(id)); //初始化 option = { title: { text: title, x: 'center', y: '90%' }, tooltip: { formatter: "{a} <br/>{b} : {c}" + unit }, toolbox: { show: false, feature: { mark: { show: true }, restore: { show: true }, saveAsImage: { show: true } } }, series: [{ center: ['50%', '50%'], number: [0, '50%'], startAngle: 240, //仪表盘起始角度 endAngle: -60, //仪表盘结束角度 //min: min, //max: max, splitNumber: 10, //分割段数 name: title, type: 'gauge', radius: '90%', splitNumber: 10, // 分割段数,默认为5 axisLine: { // 坐标轴线 lineStyle: { // 属性lineStyle控制线条样式 color: [ [0.25, '#ddd'], [1, '#ddd'] ], width: 8 } }, axisTick: { // 坐标轴小标记 splitNumber: 10, // 每份split细分多少段 length: 12, // 属性length控制线长 lineStyle: { // 属性lineStyle控制线条样式 color: 'auto' } }, axisLabel: { // 坐标轴文本标签,详见axis.axisLabel textStyle: { // 其余属性默认使用全局文本样式,详见TEXTSTYLE color: 'auto' } }, splitLine: { // 分隔线 show: true, // 默认显示,属性show控制显示与否 length: 22, // 属性length控制线长 lineStyle: { // 属性lineStyle(详见lineStyle)控制线条样式 color: 'auto' } }, pointer: { //指针粗细 width: 5 }, title: { textStyle: { // 其余属性默认使用全局文本样式,详见TEXTSTYLE fontWeight: 'bolder' }, "show": true, "offsetCenter": [0, "-30%"], "padding": [5, 10], "fontSize": 18, //"color": "auto", }, detail: { formatter: '{value}' + unit, textStyle: { // 其余属性默认使用全局文本样式,详见TEXTSTYLE color: 'auto', fontWeight: 'bolder', "fontSize": 20 } }, data: [{ //value: val, //name: name }] }] }; option.series[0].min = min; option.series[0].max = max; option.series[0].data[0].value = val; option.series[0].axisLine.lineStyle.color[0][0] = (val - min) / (max - min); option.series[0].axisLine.lineStyle.color[0][1] = detectionData(val, id); myChart.setOption(option); } /* *颜色设置, */ function detectionData(str, id) { if (id == 'pm') { //空气颜色设置 var color = new echarts.graphic.LinearGradient(0, 0, 1, 1, [{ offset: 0, color: '#56b7ef' }, { offset: 1, color: '#56b7ef' }]); option.series[0].data[0].name = '优'; if (str >= 51 && str <= 100) { color = new echarts.graphic.LinearGradient(0, 0, 1, 1, [{ offset: 0, color: '#00ab35' }, { offset: 1, color: '#00ab35' }]); option.series[0].data[0].name = '良'; } if (str >= 101 && str <= 150) { color = new echarts.graphic.LinearGradient(0, 0, 1, 1, [{ offset: 0, color: '#98c100' }, { offset: 1, color: '#98c100' }]); option.series[0].data[0].name = '轻度污染'; } if (str >= 151 && str <= 200) { color = new echarts.graphic.LinearGradient(0, 0, 1, 1, [{ offset: 0, color: '#f49c00' }, { offset: 1, color: '#f49c00' }]); option.series[0].data[0].name = '中度污染'; } if (str >= 201 && str <= 300) { color = new echarts.graphic.LinearGradient(0, 0, 1, 1, [{ offset: 0, color: '#fd2c00' }, { offset: 1, color: '#fd2c00' }]); option.series[0].data[0].name = '重度污染'; } else if (str > 300) { color = new echarts.graphic.LinearGradient(0, 0, 1, 1, [{ offset: 0, color: '#9d3f7e' }, { offset: 1, color: '#9d3f7e' }]); option.series[0].data[0].name = '严重污染'; } option.series[0].axisLine.lineStyle.width = '11'; //重置仪表盘轴线宽度 option.series[0].axisTick.length = '16'; //重置仪表盘刻度线长度 option.series[0].title.color = color.colorStops[1].color; //字体颜色和轴线颜色一致 option.series[0].title.fontSize = 30; //第一个字体变大 return color; } if (id == 'co2') { //二氧化碳颜色设置 var color = new echarts.graphic.LinearGradient(0, 0, 1, 1, [{ offset: 0, color: '#56b7ef' }, { offset: 1, color: '#56b7ef' }]); option.series[0].data[0].name = '同一般室外环境'; if (str >= 450 && str <= 1000) { color = new echarts.graphic.LinearGradient(0, 0, 1, 1, [{ offset: 0, color: '#00ab35' }, { offset: 1, color: '#00ab35' }]); option.series[0].data[0].name = '空气清新'; } if (str >= 1001 && str <= 2000) { color = new echarts.graphic.LinearGradient(0, 0, 1, 1, [{ offset: 0, color: '#f49c00' }, { offset: 1, color: '#f49c00' }]); option.series[0].data[0].name = '空气混浊'; } if (str >= 2001 && str <= 5000) { color = new echarts.graphic.LinearGradient(0, 0, 1, 1, [{ offset: 0, color: '#fd2c00' }, { offset: 1, color: '#fd2c00' }]); option.series[0].data[0].name = '头痛、轻度恶心'; } else if (str > 5000) { color = new echarts.graphic.LinearGradient(0, 0, 1, 1, [{ offset: 0, color: '#9f3979' }, { offset: 1, color: '#9f3979' }]); option.series[0].data[0].name = '严重缺氧'; } option.series[0].title.color = color.colorStops[1].color; //字体颜色和轴线颜色一致 return color; } if (id == 'voc') { //voc颜色 var color = new echarts.graphic.LinearGradient(0, 0, 1, 1, [{ offset: 0, color: '#56b7ef' }, { offset: 1, color: '#56b7ef' }]); option.series[0].data[0].name = '无效应水平'; if (str >= 0.3 && str < 3) { color = new echarts.graphic.LinearGradient(0, 0, 1, 1, [{ offset: 0, color: '#f49c00' }, { offset: 1, color: '#f49c00' }]); option.series[0].data[0].name = '感到不舒服'; } else if (str >= 25) { color = new echarts.graphic.LinearGradient(0, 0, 1, 1, [{ offset: 0, color: '#9f3979' }, { offset: 1, color: '#9f3979' }]); option.series[0].data[0].name = '出现毒性'; } option.series[0].title.color = color.colorStops[1].color; //字体颜色和轴线颜色一致 return color; } if (id == 'jqz') { //甲醛颜色设置 var color = new echarts.graphic.LinearGradient(0, 0, 1, 1, [{ offset: 0, color: '#56b7ef' }, { offset: 1, color: '#56b7ef' }]); option.series[0].data[0].name = '正常'; if (str >= 0.10 && str <= 0.20) { color = new echarts.graphic.LinearGradient(0, 0, 1, 1, [{ offset: 0, color: '#00ab35' }, { offset: 1, color: '#00ab35' }]); option.series[0].data[0].name = '轻度污染'; } if (str >= 0.20 && str <= 0.30) { color = new echarts.graphic.LinearGradient(0, 0, 1, 1, [{ offset: 0, color: '#fd2c00' }, { offset: 1, color: '#fd2c00' }]); option.series[0].data[0].name = '中度污染'; } else if (str > 0.30) { color = new echarts.graphic.LinearGradient(0, 0, 1, 1, [{ offset: 0, color: '#9f3979' }, { offset: 1, color: '#9f3979' }]); option.series[0].data[0].name = '重度污染'; } option.series[0].title.color = color.colorStops[1].color; //字体颜色和轴线颜色一致 return color; } } }) </script> </html> |
1.要想使仪表盘颜色全部一样,设置
option.series[0].axisLine.lineStyle.color[0][0] =100;